December 28, 2008

Merry Christmas and a Happy New Year!

Filed under: updates — Peter Saveliev @ 2:48 pm

Winter in WV

December 22, 2008

Algebraic topology and digital image analysis

Filed under: computer vision/machine vision/AI,mathematics,rants — Peter Saveliev @ 10:23 pm

In my last paper, I made a comment about topology of binary images: “These issues have been studied over the last 100 years or so and they are well understood”. It was pointed out to me that digital image analysis didn’t start until the 1960s, so how come?

Let me set the record straight.

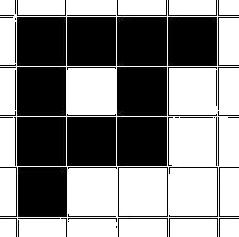
The history is this. Algebraic topology was founded by Poincare around 1900 (the title of his book “Analysis Situs” converted from Latin to Greek turns into “topology”). There was no talk about binary images, obviously. What they studied was cell complexes, collections of cells attached to each other in an appropriate way. The cells were initially only triangular but later of any shape. It was also informally assumed that all topological theorems are independent of the cell decomposition or representation. This fact was formally proven by the 1950s, roughly. By then all the issues had been settled and algebraic topology had become one of the central disciplines in mathematics. The fist monographs were written in the 1930s (Alexandroff&Hopf) and first (graduate) textbooks were written in the 1960s (Hilton&Wiley, Mac Lane, Spanier, and many more).

Undergraduate books are rare (one that I like the most and use is Topology of Surfaces by Kinsey). Courses are even rarer. As a result, computer scientists (and even mathematicians) are often unfamiliar with the well established ways of dealing with even the most elementary topological issues (and I mean really elementary: how many objects, which ones have holes or tunnels and how many, etc.)

Even though relevant papers pop up once in a while, the connection of image analysis to algebraic topology is not a common knowledge among practitioners of computer vision and image analysis. I know this from personal experience…

The main reference on the subject is Computational Homology by Kaczynski, Mischaikow, and Mrozek. This is still very much a graduate text. Hopefully, our wiki is more accessible.

December 13, 2008

Pixcavator 3.3 released

Filed under: image processing/image analysis software,software releases — Peter Saveliev @ 11:45 pm

Soon after version 3.2, the next one is here. There are a couple of changes.

First, a feature was added to help with image exploration. As you move the mouse around the analyzed image, the object you hover over is highlighted. The contour is shown blue and, if “Color objects” is chosen, the whole object is colored. The data about it is displayed under the image as before.

Second, the limitations on the kind of objects to be captured have been removed. To avoid dealing with excessive number of objects in the image and the spreadsheet, only objects with “saliency” above a certain threshold were taken into account and displayed. There have been no complaints about that until recently. A manufacturing company needs to analyze an 1000×2000 image which is almost all black with a few light dots here and there (1-3 pixels in size). In the new version even objects this small will be captured. However, the number of objects will be limited to 1000.

December 8, 2008

“Can you help me analyze these images?”

Filed under: image processing/image analysis software,updates — Peter Saveliev @ 3:29 pm

This is a question that has been asked many times over the last few months. The answer is always positive but some things need to be clarified.

If you need help with your images (via Pixcavator), there are three main options.

Option 1. I analyze the image myself.

There are some choices to be made about the analysis settings however. Then I’d have to base my decisions on common sense without any understanding of the problem. For example, I may try to capture the most prominent – large, high contrast, round, etc - features in the image and ignore the rest. It is very easy to end up solving a wrong problem. At best, the result will be a sample of what Pixcavator can do.

For more meaningful results, therefore, the image should be analyzed by a person who knows that he needs to find in the image.

Option 2. The user analyzes the image.

To find the right settings, a fair amount of trial and error may be needed. Fortunately, Pixcavator is very easy to learn. As the user can start experimenting with Pixcavator, he will quickly come to understand the affect of moving the sliders on the development of the contours.

There is a danger however that the settings that have been found won’t work for the next image.

Option 3. The user describes what he wants to find in the image.

Then I can base my analysis on this description. However, I am likely to be unfamiliar with the terminology of your field and can’t tell what you are looking for based solely on your verbal explanations. For this approach to work, the description will have to be very specific and include the sizes, shapes, colors, locations of objects to be found in the image.

Alternatively, you would provide me with a few images that have been analyzed manually. For this approach to work, the user will have to outline in the image the features he is interested in (example below). Then I would try to reproduce your results with Pixcavator. Then, if this works, I would try to apply the analysis to other images.

Keep in mind that it is always possible that the image is too complex or of too poor quality for a meaningful analysis.

December 1, 2008

Pixcavator 3.2 released

Filed under: image processing/image analysis software,software releases,updates — Peter Saveliev @ 12:42 am

The latest version of our image analysis software is out!

Pixcavator was initially designed primarily for counting: cells, objects, and other features. Everything is designed around this task: the clickable contours, the spreadsheet, the averages of the measurements, etc. Now, more and more often we see Pixcavator used for measuring. The reason is simple. Manually measuring the area, or perimeter, of a complex object is close to impossible even if the image is clear and the object is has well defined borders.  A medical example is here and another one here.

Pixcavator captures contours of all objects – light and dark - and displays all their measurements. If, however, there is just one object but with a few holes, it is important to see that this data gives you the area of what’s inside the contour. What you frequently need instead is the area of the object,  which is

the area of what’s inside the contour - the areas of the holes.

The main new feature in version 3.2 is a step in that direction. Pixcavator now displays the two numbers above - the total area of dark and the total area of light – as percentages of the total size of the image (under Review summary, second row). So, to find the area of a dark object with light holes in it, one has to subtract these two numbers. (Caution: You have to make sure however that the holes are in the object not the background).

Download Pixcavator 3.2 here.