Company
For photographers
For researchers
For developers
Image gallery
Blog

February 27, 2008

ImageJ vs. Pixcavator

Filed under: releases, image processing/image analysis software, reviews — Peter @ 4:33 pm

Here we compare the capabilities of ImageJ (without plug-ins) and Pixcavator 2.4 in analysis of gray scale images. The links will take you to the relevant articles in the wiki. Update: The list is addressed mostly to the users. For the developers, there will be a similar list comparing ImageJ (including plug-ins) and Pixcavator SDK.

Tasks and features

ImageJ

Pixcavator

Analysis of the gray scale  image after binarization

Yes

Yes

Computation of binary characteristics of objects/particles

Yes

(A specific binarization has to be found first by thresholding or another method.)

Yes

(The characteristics are computed for all possible thresholds.)

size/area

Yes

Yes

circularity/roundness

Yes

Yes

centroid

Yes

Yes

perimeter

Yes

Yes

bounding rectangle

Yes

No

(Useless for such applications as microscopy where the results should be independent of orientation)


Analysis of the gray scale  image without prior binarization

Limited

Yes

Detection of objects as max/min of the gray scale

Yes

Yes

Filtering detected objects (in order to deal with noise etc)

Yes

(with respect to contrast only)

Yes

(with respect area, contrast, roundness, and saliency)

Counting objects/particles

Yes

Yes

Image segmentation method

Watershed - for either max or min but not both (dark or light objects but not both)

Topology (both dark and light objects)

Computation of gray scale characteristics of objects

No

Yes

contrast

No

Yes

center of mass

No

Yes

saliency/mass

No

Yes

average contrast

No

Yes


Automatic analysis

Yes

Yes

Semi-automatic mode

No

Yes

(based on objects found for all possible thresholds)

Manual mode

No

Yes

(full control over found objects)

User interface

Hundreds of commands in drop down menus

4 sliders, 7 buttons

User experience (mine)

“Wrong image format!”

“Threshold first!”

“Results unsatisfactory? Start over!”
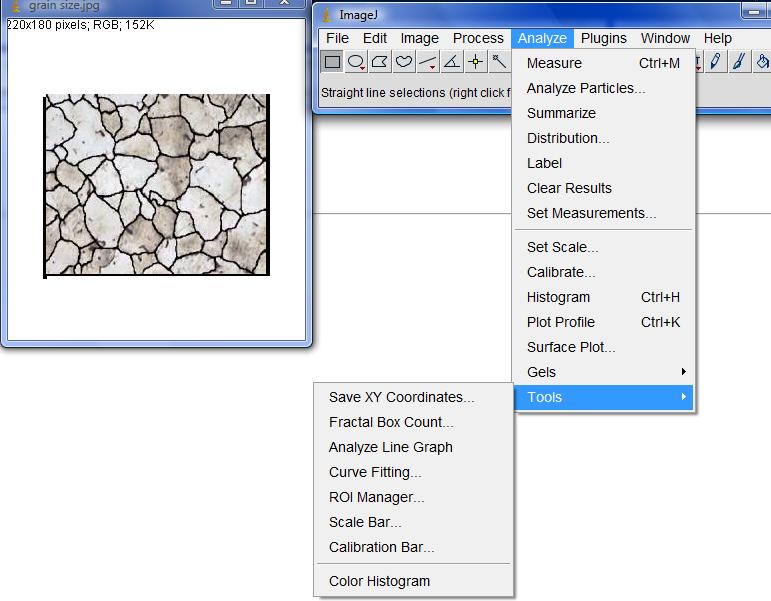
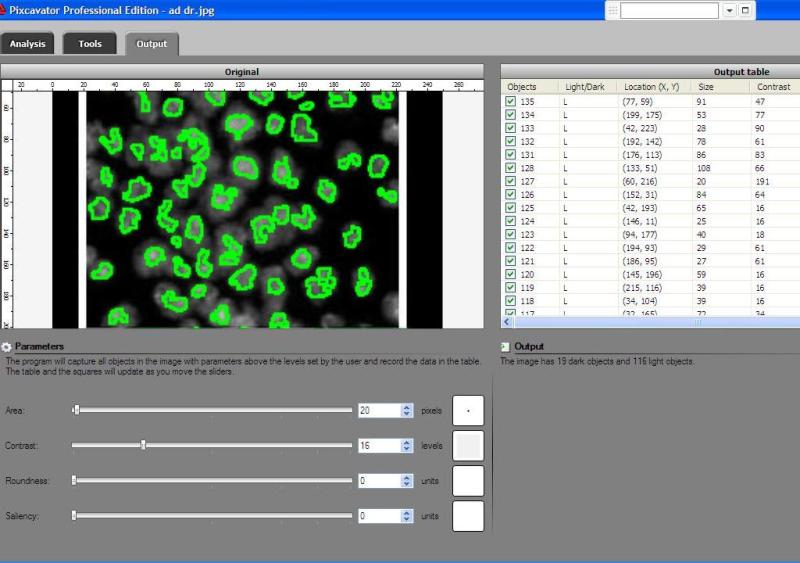
Move sliders, click buttons

Try it!

Screenshots

Update: The main criticism has been that some positive things about ImageJ are missing from the table. They are added below (not about image analysis but still). On the other hand, none of the statements in the above part has been questioned.

Platforms
Windows, Mac, Linux
Windows only (cellAnalyst web application soon to come)
Price
Free
$150 (free trial)


February 21, 2008

Graph representation of gray scale images

Filed under: computer vision/machine vision/AI, mathematics — Peter @ 6:18 pm

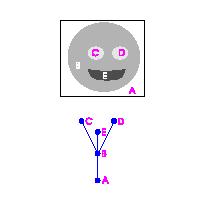
Recently, I had an opportunity to reread some of the papers on this subject. One of them has an especially simple example and I decided that this may be an appropriate place to make a comparison to the way we do this.

The paper (and others by these authors) I am referring to is:

J. Andrew Bangham, J. R. Hidalgo, Richard Harvey, Gavin C. Cawley, The Segmentation of Images via Scale-Space Trees, British Machine Vision Conference, 1998.

Their algorithm (called “sieve”) produces a tree decomposition of gray scale images as follows. It cuts (simultaneously!) minima and maxima of the gray scale function - slice by slice. The result is a hierarchy of objects (called “granulas”) that is recorded as a tree. Their example is on the right.

This tree may resemble our frame graphs – until you build one. This is what it looks like. He
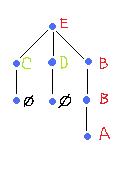
re the gray scale levels run from 0 (E) to 255 (A).

Generally the frame graph isn’t a tree (try the negative of this image). This comes as a consequence of treating light and dark objects (maxima and minima) separately and independently. Indeed, dark objects may merge while light objects may split as you go up the gray levels.

There are other issues. First, the central (in my view) question of what is object in a gray scale image and how to count them isn’t addressed in this and related papers. Second, the approach is only partially applicable to 3D images as there is no way of capturing tunnels without homology. Third, it is unclear how this approach can be applied to color images.

Other than that I like those papers because the testing performed by this group validated our approach.

February 15, 2008

Why machine learning never works

Filed under: computer vision/machine vision/AI — Peter @ 8:22 pm

I am exaggerating of course – it works sometimes. In my view, however, it can only work under very narrow circumstances. I explain this below.

In response to my previous post Bob Mottram wrote “Using many learning algorithms (genetic, neural, etc) it is very easy to categorise images on some very trivial basis. In theory the larger the data set the harder the system has to work and the less likely it is to find a quick “cheat”, but it all depends upon how features are being represented in the system.”

As I have expressed this view many times, I want to use this opportunity to clarify my thinking a bit. In my post I described machine vision as follows: “collect as much information about the image as possible and then let the computer sort it out by some kind of clustering”. That seems like a good plan. The test I suggested previously is to teach the computer to add without revealing that it’s dealing with numbers, i.e., symbolically. This time, let’s test it instead on a very simple computer vision problem.

Given an image, find out whether it contains one object or more.

Let’s assume that the image is binary so that the notion of “object” is unambiguous. Essentially, you have one object if any two 1’s can be connected by a sequence of adjacent 1’s. Anyone with a minimal familiarity with computer vision (some even without) can write a program that solves this problem. But that’s irrelevant here because the computer is supposed to learn on its own, as follows.

  1. You have a computer with some general purpose machine learning program (meaning that no person provides insight into the nature of the problem).
  2. Then you show the computer images one by one and tell it which ones contain one object.
  3. After you’ve had enough images, the computer will gradually start to classify images on its own.

There is no reason to say that this can never work. But I have a couple of questions.

First, why gradually? Why not give the computer all information at once and instantly become good at the task? One drawback is that you can’t keep tweaking the algorithm. But I think the main reason why machine learning is popular is that everyone likes to teach. It’s fun to see your child/student/computer learn something new and become better and better at it. This is very human – and also totally misplaced.

My second question is, This can work but what would guarantee that it will? More narrowly, what information about the image should be passed to the computer to ensure that the computer will succeed more then 50% of the time, sooner or later?

Option 1: we pass all information. Then, this could work. For example, the computer represents every 100×100 image a point in the 10,000-dimensional space and then runs clustering. First, this may be impractical and, second,.. does it really work? Will the one-object images form a cluster? Or maybe a hyperplane? One thing is clear, these images will be very close to the rest because the difference between one object and two may be just a single pixel.

Option 2: we pass some information. What if you pass information that cannot possibly help to classify the images the way we want? For example, you may pass just the value of the (1,1) pixel, or the number of 1’s, or 0’, or their proportion. Who will make sure that the relevant information (adjacency) isn’t left out? Computer doesn’t know what is relevant – it’s hasn’t learnt “yet”. If it’s the human, then he would have to solve the problem first, if not algorithmically then at least mathematically. Then the point of machine learning as a way to solve problems is lost.

BTW, this “simple” challenge of counting the number of objects may also be posed for texts instead of images. That one is for Google and the people who dream of “semantic web”!

My conclusion is, don’t apply machine learning in image search, image recognition, etc, anywhere software is expected to replace a human and solve a problem.

So, when can machine learning be useful? In cases where the problem can’t be, or hasn’t been, solved by a human. For example, a researcher is trying to find a cause of a certain phenomenon and there is a lot of unexplained data. Then - with some luck - machine learning may suggest to the researcher a way to proceed. “Pattern recognition” is a better name then.

February 8, 2008

Computer vision vs. human vision, another optical illusion

Filed under: computer vision/machine vision/AI — Peter @ 1:59 am

optical illusionRecall that last time we considered the issue how computer vision isn’t fooled by optical illusions. Especially good it was it at defeating illusions based on measurements. There was one toss-up. A (uniformly) gray bar was not recognized as an object because its background varied from lighter than that of the bar to darker.

Now let’s take a look at something similar - the “same color” illusion. These letters have the exact same gray level, but one looks darker - in the second image. A common reaction is “OMG, it’s hard to believe! They look totally different!” The question is, is it a mistake to see them as different? optical illusion

In my view the fact that these letters have the same gray level is incidental. After all, they aren’t even close to each other. What is much more important is how each object fits into the image. What a person sees first is the relation between the object and the adjacent area (the background). The crucial difference is then that one A is dark on light background and the other is light on dark. It turns out, one is “dark” and the other is “light” – even though they have the same gray level! Why is this distinction so important? Look at it this way – the “dark” is an object while the “light” is a hole (or vice versa).

So what’s the conclusion? The two identical A’s look different because they are different! In fact, computer vision should follow human vision here and should be “fooled” by this “illusion” (analysis with Pixcavator below: dark objects are red, light are green).

optical illusion

February 1, 2008

Pixcavator 2.4 released - software for scientific image analysis

We are proud to announce the release of Pixcavator 2.4!

Pixcavator produces a list of all objects in the image. The list contains the size, location, and other characteristics of each object. Meanwhile, the objects in the image are captured with contours. Pixcavator is as simple as Excel.

These are the changes in comparison to version 2.3: 

  • The interface has been streamlined. Pushing “Run” will now take you straight to the output. The “simplification” sliders have been removed (they will reappear in the image editing version of Pixcavator to appear in the near future). 
  • More data is provided about the objects in the image. The table now contains additionally: roundness, perimeter, and average contrast. 
  • Some bugs have been fixed. In particular, computation of the contrast and the saliency for light objects was incorrect. The computation of perimeter and roundness has been made more accurate (see the discussion here). 
  • The user’s guide has been updated.

Download here. The updated SDK will appear in a few weeks.


| Home | Site map | Terms & Conditions | Contact us |                       Copyright© Intelligent Perception Inperc.com