December 5, 2007
A few recent developments:
The number of downloads of Pixcavator 2.3 has reached 10,000.
Idee has re-launched its visual image search application. There is no image uploading and as a result no way to test it. But even sSearching within its own collection of images indicates that shapes aren’t given serious consideration. More on image search here. More updates to come.
Last Sunday Ash Pahwa and I attended the exhibit of the annual meeting of the American Society for Cell Biology in Washington DC. We talked with some companies that make image analysis and related software. Nothing spectacular. Most interesting was the conversation with Ilya Goldberg, the representative of OME (Open Microscopy Environment).
A quick analysis revealed that the time complexity of the image analysis algorithm that runs Pixcavator is O(n2), where n is the number of pixels in the image.
November 30, 2007
Yes, part 6! I thought I was done with the topic (Part 1, Part 2, Part 3,…), but a couple of days ago I ran into this blog post: General connectivity (MATLAB Central) . The issue is connectivity in digital images: 4-connectivity, 8-connectivity, and other “connectivities”. The issue (adjacency of pixels) is discussed in the wiki. When I wrote this article though I did not realize that the topic is related to measuring lengths of curves. Indeed, the 8-connectivity produces curves that go only horizontally or vertically while the 4-connectivity allows diagonal edges as well. In the post the curves appear as “perimeters” of objects. More accurately, they should be called contours or boundaries of objects as the perimeter is mathematically the length of the boundary (that’s where “meter” comes from). But bwperim is the name of the standard MATLAB command for finding the boundary and we will have to live with that…
My problem is with this idea: if you are a coder it is important to make the right choice of connectivity. Let’s break this into in two statements:
- The choice of connectivity is important.
- The choice of connectivity is up to the coder.
The second statement reflects a general attitude that is very common - be it MATLAB or OpenCV. Important decisions are left to the coder and are hidden from the user. If something is important, I as a user would want software that produces output independent of a particular implementation. The two statements simply contradict each other.
Now, is the choice of connectivity really important?
My answer is NO.
The change of connectivity changes the boundary of the object and, therefore, its perimeter. This seems important. But we are interested of the perimeter of a “real” object, which should be independent (as much as possible) from the digital representation. This perimeter is the length of a “real” curve – the boundary of the object. We showed (in Part 3) that the relative error of the computation of length does not diminish with the growth of the image resolution. The accuracy is improved only by choosing more and more complex ways to compute the length (roughly, increasing the degree of the approximation of the curve). The choice of connectivity is determined by a 3×3 “matrix” (it’s not a matrix, it’s just a table! – another annoying thing about MATLAB). With finitely many choices the error can’t be reduced to arbitrary low. You may conceivably improve the accuracy if you can choose larger and larger “matrix” (table!), but that seems pointless…
There is another reason to think that this choice isn’t important. About that in the next post.
P.S. To clarify, every matrix is a table but not every table is a matrix (even if it contains only numbers). It is my view that tables should be called matrices only in the context of matrix operations especially multiplication. In particular, a digital image is table not a matrix.
November 25, 2007
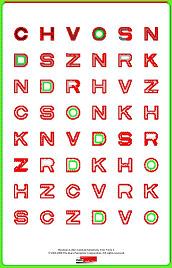
Both images below read “Hello!”. Yes, both! If you don’t believe it, copy the “blank” image and sharpen it with any photo editing software (”Auto Contrast” in Photoshop). However, you need to do that only for the sake of humans - computers don’t need it! If you run Pixcavator, the result will be similar to the image on the right. The moral is: image “enhancement” tools have nothing to do with computer vision.
 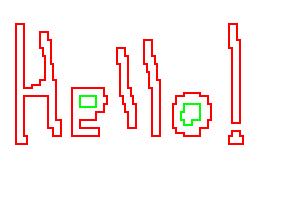
Here is another example.
November 19, 2007
Dr. Ash Pahwa and I will give a presentation at Workshop on Bio-Image Informatics: Biological Imaging, Computer Vision and Data Mining, 2008, Center for Bio-Image Informatics, UCSB, Santa Barbara, CA, USA, January 17-18, 2008. The abstract is below.
A Topological Approach to Cell Counting
Peter Saveliev (Marshall University, Huntington, WV) and Ash Pahwa (Mayachitra Inc., Santa Barbara, CA)
Cell counting and identification is a common task in biology and pathology. To automate this task one has to approach it as an image segmentation problem. Many researchers have solved this problem following various strategies. The approach we propose relies on topology, which is the science of continuity and connectedness that studies spatial relations within the image. An image pixel is defined to have 4 vertices (corners), 4 edges, and one face. Algebraic topology uses algebraic operations with these objects to count the number of completed cycles – circular sequences of edges. The completion of a cycle indicates the presence of a cell. In the case of gray scale, our strategy for counting cells is to count dark objects with light background and light objects with dark background. The types of images our algorithm is most suitable for are those that represent something 2-dimensional (rather than 2D images of 3D objects) such as images of cellular tissue or blood cells under a microscope.
The topological nature of the algorithm makes it especially suitable for cell counting. First, the count of cells is independent of their locations. Second, the measurements of cells are independent of their orientations with respect to the image grid. Third, the algorithm captures cells and other features regardless of their sizes, shapes, and locations with no deformation, smoothing, blurring or approximation.
We developed a software suite called cellAnalyst with the following output: the image with cells’ contours captured and a spreadsheet with cells’ locations and characteristics such as area, perimeter, intensity, and contrast. The processing starts with an automatic analysis of the image that produces a graph that contains complete data about the image. The user proceeds in a semiautomatic mode to interactively visualize various segmentations. By moving sliders corresponding to cells’ characteristics the user instantly changes the cells’ boundaries and can choose the most appropriate segmentation. The output data is then updated in real time. The user can also exclude noise and irrelevant details from the analysis by simply clicking on them.
The analysis data has been verified using pathology and retinal images. The images are analyzed by manually counting, identifying, and measuring cells and the results are compared with the output of cellAnalyst. The matches have been reliable and repeatable.

November 15, 2007
A few days ago I received an e-mail from Lenny Kontsevich, CTO of Cognisign. They run xcavator.net (an unfortunate choice of name…) which is a visual image search site. Dr. Kontsevich expressed his disagreement with the review of their application in our wiki. The review is just three short sentences describing the application and my experience with it:
xcavator.net: Semi-manual search based on recording the color at key points chosen by the user. Seems like a good idea, why doesn’t it work? Experiment: an image of rose with 20 key [points] returns an image of a girl in a red bikini.
I want to describe exactly where this came from and give an update.
When I tried the application last year, it seemed that the approach to image matching and search was the following: by placing key points on the image you help the computer concentrate on the important parts. The computer can match images by studying them as a whole; for example, using the color histogram of the image. However you may be interested in matching only a part of the image in order to find different images depicting the same object. Then you need to have the capability for the user to select that object or a part of it. That’s the way I understood this application.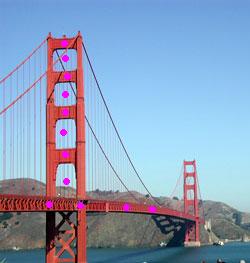
First, I watched carefully the video introduction. The sample image they showed was the Golden Gate Bridge and they put points in the right parts of the bridge: the metal parts of the frame and the holes in the frame. The end result was a series of very good matches of the bridge. The reason was that the points (less than a dozen) were chosen so well that there may be no other image that would have pixels of those colors located the same way with respect to each other. This approach made perfect sense to me.
Next I followed the instructions exactly. I picked an image of a flower and placed key points around the center (red) and in the middle (black). The result was a few red roses but at the same time each time I added a point to the original (10, then 20) one image would never disappear among the matches. It was the image of a girl in a red bikini.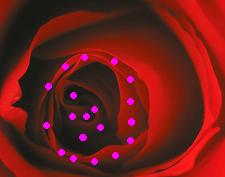
Clearly that was not supposed to happen. The colors were matched but not the locations of the colors. My conclusion was that either this was a bug or I simply misunderstood the method.
This experiment was what I reported in the blog (more than a year ago!). Later I also copied the report to the wiki. Unfortunately, the word ‘points’ in “20 key points” was lost. That may give (and it did) the impression that I chose 20 key words. The meaning changes completely. The review was also copied without the date. That may also have contributed to the misunderstanding because since then many things have changed. There is no Golden Gate Bridge anymore in the introductory video. It seems that the whole application is now much less about matching color+position and more about colors alone and especially tags.
The instructions still mention shapes. Repeating my experiment I didn’t get the girl in a red bikini this time. However I was unable to evaluate how much shapes contribute to image matching. The reason is that the matches are made firstly on the base of the color and on the base of tags. You would never know whether the match was based entirely on colors and tags or on shape as well. There is no image upload and that’s what prevented me from testing in any further. This situation is not uncommon in this area. There are also no links that would help you understand how things work and I was not about to engage in “investigative reporting”.
Of course I’m biased here - I simply do not care about matching based on colors. What I am interested in is the image search technology that is independent of color and of course independent of tags. In some areas, such as radiology, all images are gray scale. That said, the purpose of xcavator.net is to help customers to search those huge collections of stock images. That seems to work fine.
The review of course will have to be updated.
November 13, 2007
I’ve been wondering about the methods behind Definens’ image analysis software for a while. Explanations I’ve seen are very sketchy and superficial. Now I ran into this blog and this picture. This is more interesting! There is no explanation how the graph is built but the approach is natural (same as we take).

I thought I was done with the topic but I just discovered that I messed up with the code. And I didn’t notice the problem because I didn’t test the program well.
Here is how it happened. The algorithm for roundness computes the perimeter first. More precisely, it computes the “adjusted” perimeter. The reason is that the perimeter computed as the number of steps in the curve depends on the orientation of the curve with respect to the grid. This “first degree approximation” produces the same roundness for a square and a 5×1 rectangle. To compute the better adjusted perimeter we use the “second degree approximation” that takes into account both the perimeter and the curvature (number of turns). Some error is still there but the results were supposed to be much better. And they were until I tried a diagonally oriented square. The roundness was way off!
Fortunately no-one was hurt and the error was quickly located and fixed. The results are slightly different though. Pixcavator can’t distinguish circles and squares unless they are quite large. Circles of diameter 100 and squares 100×100 both have roundness close to 80. However, circles of radius 200 have roundness 89. That of course makes sense. As before elongated objects are easily detectable. For example, the roundness of a 200×200 rectangle is 79 while that of 200×270 is 77. I’ll need more testing. The article in the wiki is being rewritten.
November 7, 2007
From the three previous posts on the topic (Lengths of digital curves, parts 1, 2, 3) and a little presentation I gave recently I created an article for the wiki. In comparison, analysis is more extensive and there are more illustrations. At the end there are two examples of computation of roundness with Pixcavator 2.4. Circles have roundness close to 90, squares close to 80. It works quite well for large objects. You can now distinguish between circles and squares and between squares and elongated objects. For example, you have now a new way to automatically count (round) cells in the image and ignore (rough edged) noise.
November 4, 2007
In the last post I asked “If you can teach computer to recognize objects, you can teach it simpler things. How about teaching computer how to add based entirely on feedback?” I was going to write a post about this but the next day I got an opportunity to approach this differently. At Hacker News I read the post How to teach a Bayesian spam filter to play chess. So I presented this (implicit) challenge.
How about teaching it how to do ADDITION?
This would be a better experiment because (1) it is simpler and faster, (2) the feedback is unambiguous, (3) the ability to add is verifiable.
Essentially you supply it with all sums of all pairs of numbers from 0 to 99 and then see if it can compute 100+100.
You can see the whole discussion here (my comments are under ‘pixcavator’). Let me give you some highlights.
First, it was educational for me. Books and sites were generously recommended. This one made me laugh:
My personal recommendation on machine learning is ‘Pattern Recognition and Machine Learning’ by Chris Bishop. But you definately do need a solid mathematical background for that.
I read some of what was recommended about Bayesian method and neural networks – they were mostly irrelevant but interesting nonetheless. The discussion helped me to formulate the answer to my own challenge:
Numerically this is easy, symbolically impossible.
The OP did not take up the challenge but a few people responded positively – yes, the problem can be solved. I started to pose ‘naïve’ questions and it was fun to watch people dig themselves deeper and deeper. This one is my favorite (really deep):
Question: So given a function with f(’1′,’1′)=’2′, the computer will figure out that f(’1′,’2′)=’3′, right?
Answer: Yes, that’s what I’m talking about.
Another one:
Question: Where would the idea of “is bigger than” or “is the following number of” come from if not from the person who creates the network?
Answer: Training examples.
Question: Computers can form concepts, really?
Answer: If you want them to learn a specific concept that we know, they can learn it, yes.
This ‘yes’ is in fact a ‘no’.
As much fun as it was, I was kind of hoping that at least one person would see the light. No such luck…
November 2, 2007
Recently I read this press release: computers get “common sense” to tell a tennis ball from a lemon, right! I quickly dismissed it as another over-optimistic report about a project that will go nowhere. Then I read a short comment (by ivankirgin) here about it.
Common sense reasoning is one of the hardest parts of AI. I don’t think top-down solutions will work. …You can’t build a top down taxonomy of ideas and expect everything too work. You can’t just “hard code” the ideas.
I can’t agree more. But then he continues:
I think building tools from the ground up, with increasingly complicated and capable recognition and modeling, might work. For example, a visual object class recognition suite that first learned faces, phones, cars, etc. and eventually moved on to be able to recognize everything in a scene, might be able to automatically perhaps with some training build up the taxonomy for common sense.
First, he simply does not go far enough. I’d start with even lower level – find the “objects”, their locations, sizes, shapes, etc. This is the “dumb” approach I’ve been suggesting in this blog and the wiki. Once you’ve got those abstract objects, you can try to figure out what those objects represent. In fact, often you don’t need even that. For example, for a home security system you don’t need to detect faces to sound alarm. The right range of sizes will do. A moving object larger than a dog and smaller than a car will trigger the alarm. All you need is a couple of sliders to set it up. Maybe the problem with this approach is that it’s too cheap?
Another point was about training and machine learning. I have big doubts about the whole thing. It is very much like trying to imitate the brain (or something else we observe in nature). Imagine you have a task the people do easily but you don’t understand how they do it. Now you solve the problem in these three easy steps.
- You set up a program that supposedly behaves like the human brain (something you don’t really understand),
- you teach it how to do the task by providing nothing but feedback (because you don’t understand how it’s done),
- the program runs pattern recognition and solves the problem for you.
Nice! “Set it and forget it!” (Here is another example of this approach.) If you can teach computer to recognize objects, you can teach it simpler things. How about teaching computer to add based entirely on feedback? Well, this topic deserves a separate post…
October 29, 2007
The title may sound sensationalist but it came from this study outlined at ScienceDaily.com. Here is the full quote:
When people are asked to search for an item that will appear only once in 100 images, they might miss as many as a third of the objects they’re supposed to be finding. Studies of radiologists looking at images to find cancer have shown similar error rates.
I think this fact provides new evidence in support of the use of computer aided diagnosis (CAD). It is happening but the progress is very slow. Screening seems the most appropriate starting point. It could be cancer or blood work (see the article on cell counting in our wiki).
October 27, 2007
Recall that in the previous posts we discussed what happens if one computes the length of a curve in a digital image as the total sum of distances between consecutive points. The conclusion was that using the length computed this way to evaluate the shapes of objects leads to disastrous results.
What do we do?
Let’s review. Computing lengths of horizontal and vertical segments produces correct results. Computing lengths of diagonal segments leads to a 40% error. To fix that, every time we have a triple of consecutive points arranged in a triangle we should replace 1+1=2 in the computation with √2. The result is that now all 45 degree segments have correct lengths! Great!

Great? Not quite. What about 22.5 degree segments? To make matters simpler consider instead segments with 2 horizontal steps followed by 1 vertical. We compute its length as 1+√2, which is about 2.41. Meanwhile the “true” length is √(2^2+1^2) = √5, which is about 2.24. The error is almost 8%!
Once again, what do we do? Very simple, we take into account this new type of segments. Now we have three types: horizontal/vertical, diagonal, and now 2-straight-then-turn. To compute the length of a curve we break it into segments of the three types and add their lengths.
You can predict what happens next. We try 22.5/2 degree – there will still be an error. And so on. There is no exact method to compute the length of a digital curve, locally.
This is the idea – as I understand it – of the paper On Local Definitions of Length of Digital Curves by Mohamed Tajine and Alain Daurat. One breaks a curve into a sequence of “small” (n steps) curves, each small curve is assigned a length (it does not have to be the distance from the beginning to the end), then the length of the original curve is the sum of those. Simple enough. The caveat was discussed previously. As the resolution approaches 0, the length computed this way should converge to the “true” length. Generally, it does not!
The paper proves that this “local” approach can’t produce the exact result no matter how large n is. Of course, you can interpolate the curve and measure the result. But that’s a can of worms that deserves a separate discussion.
The result is interesting. It’s helpful too in the sense that you don’t have to waste your time trying to find a solution to a problem that can’t be solved.
I do have a minor criticism. The curve is a sequence of “small” curves consecutively attached to each other, fine. Once you start to compute the length, however, the way they are attached is thrown out. If you don’t want to lose information, you should allow the curves to overlap, by a single pixel. My guess is that the result would still stand.
Another issue not discussed in the paper is that the error goes down as n increases. This is a good news because it allows one to produce meaningful results in shape evaluation. About that in the next post.
October 24, 2007
 Caught a CSI show and started to reminisce. Tons of cool equipment including computers of all kinds and software from the 22nd century. Fingerprint identification? In seconds! DNA analysis? A snap! Even face recognition (ha!). At the same time you see them staring at those old fashioned light microscopes. The CSI people do their investigations in Second Life now but never use digital microsopes. Fiction? Caught a CSI show and started to reminisce. Tons of cool equipment including computers of all kinds and software from the 22nd century. Fingerprint identification? In seconds! DNA analysis? A snap! Even face recognition (ha!). At the same time you see them staring at those old fashioned light microscopes. The CSI people do their investigations in Second Life now but never use digital microsopes. Fiction?
October 20, 2007
 Recall that in the last post we observed that, since a curve in a digital image is represented as sequences of points, it is natural to think of its length as the total sum of distances between consecutive points. However, with this approach the length of a diagonally oriented segment will be overestimated by 40%. Recall that in the last post we observed that, since a curve in a digital image is represented as sequences of points, it is natural to think of its length as the total sum of distances between consecutive points. However, with this approach the length of a diagonally oriented segment will be overestimated by 40%.
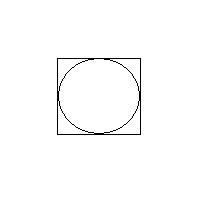
In the case of digital images, to compute the perimeter of an object we simply count the number of vertical and horizontal edges. Here is one interesting consequence. The perimeters of a square and the inscribed circle are the same!
Here is a more practical example. Suppose we want to classify objects in an image, like the one on  the right. Suppose we have detected and captured these objects and now all we want to do is to tell nuts from bolts. Let’s adopt a “dumb” approach and try to use the simplest method available. Then some of these objects can be classified based on size only. However, there are some bolts and nuts of about the same size and we have to look at their shapes. That does not work out as you’d expect. the right. Suppose we have detected and captured these objects and now all we want to do is to tell nuts from bolts. Let’s adopt a “dumb” approach and try to use the simplest method available. Then some of these objects can be classified based on size only. However, there are some bolts and nuts of about the same size and we have to look at their shapes. That does not work out as you’d expect.
The “roundness”, area/(perimeter squared), will be lower for elongated objects, like bolts. This works perfectly well in the continuous domain but in the digital domain it is possible to think of very different shapes with both area and perimeters exactly same. Take a diagonally oriented square with side a. Then its area is a*a and it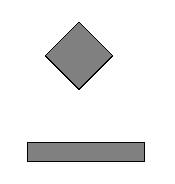 s (digital) perimeter is 4*√2*a. Now, a horizontally oriented rectangle (√2+1)*a by (√2-1)*a will have the same measurements. The proportions of this rectangle are about 1-to-5. It’s a bolt that looks like a nut… s (digital) perimeter is 4*√2*a. Now, a horizontally oriented rectangle (√2+1)*a by (√2-1)*a will have the same measurements. The proportions of this rectangle are about 1-to-5. It’s a bolt that looks like a nut…
In the next post I will briefly discuss a paper on this subject.
October 12, 2007
Look at this press release Lockheed Martin to Develop Automated Object Recognition Using Brain-Inspired Technology. To be inspired by brain they would need to understand how it works. Do they, really? Where did they stash their Nobel prize? Apparently, they know how a person looking at an apple forms the word ‘apple’ in his brain. If a scientist made such a claim, it would be immediately challenged - by other scientists. But as long as this is a “technology”, people will believe anything. And some (DARPA) even pay money for it!
This is also a part of another pattern – trying to emulate nature to create new technology. The idea is very popular but when has it ever been successful? Do cars have legs? Do planes flap their wings? Do ships have fins? What about electric bulb, radio, phone? It’s silly to think that computers will be an exception. End of rant.
« Previous Page — Next Page » |
|
|