This page is a part of CVprimer.com, a wiki devoted to computer vision. It focuses on low level computer vision, digital image analysis, and applications. It is designed as an online textbook but the exposition is informal. It geared towards software developers, especially beginners, and CS students. The wiki contains mathematics, algorithms, code examples, source code, compiled software, and some discussion. If you have any questions or suggestions, please contact me directly.
Cell counting
From Computer Vision Primer
Contents |
Cell counting and classification
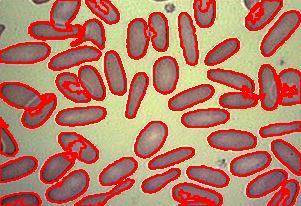
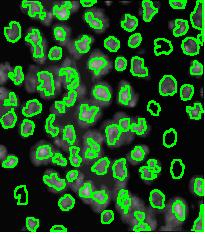
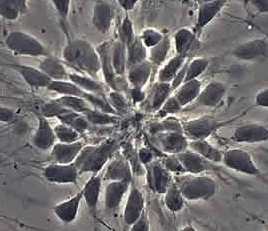
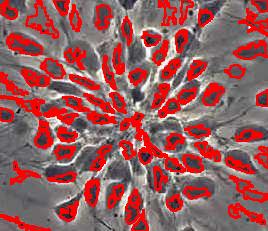
Counting cells is a task common in biology and pathology image analysis. Cell counting/identification is an image segmentation problem. Other researchers have solved this problem using different strategies such as watershed, level-sets, and other methods. We use algebraic topology. Topology is the science of continuity and connectedness that studies spatial relations within the image. Algebraic topology treats these issues by means of algebraic operations on the pixel/edge/vertex level. The topological analysis and decomposition of the image is carried out through computation of the so-called homology groups. These structures consist of cycles around cells and record the way the image is segmented. Download the free Pixcavator Student Edition here.
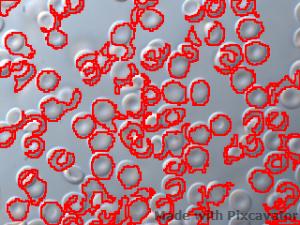
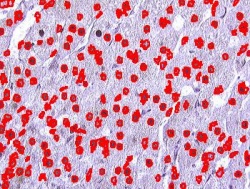
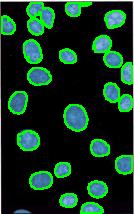
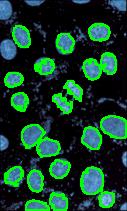
Our counting strategy in case of gray scale images is the following. First the image is converted into 256 binary images by means of thresholding. As the pixels of the image are analyzed we count the completed cycles outside and inside the cell. The completion of a cycle indicates a cell. Our strategy for cell counting is to count dark objects with light back ground and light objects with dark background.
Our algorithm is explained under Binary Images and Grayscale Images. The topological approach has important consequences make the algorithm especially appropriate for the task of cell counting.
- First, the count of cell is independent of their location.
- Second, the measurements of cells are independent of their orientation with respect to the image grid.
- Third, the algorithm captures cells and other features regardless of their sizes, shapes, and locations. The analysis is lossless.
Other tasks related to analysis of cells:
- Cell classification. Pixcavator looks only at the geometry of the cells so you can try to classify them based on that. So far there are only two geometric characteristics: Area and Roundness. That's a start and in the future we'll have higher Moments as well. There is also intensity and contrast. Once you have the cells in Excel you can plot histograms of any of these characteristics or their combinations.
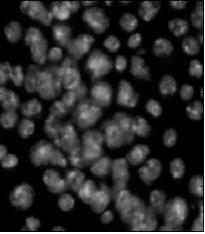
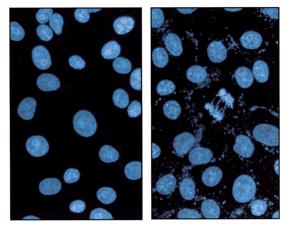
- Cell/nuclei ratio. One can count nuclei separately from cells - you just need find appropriate settings for the sizes of objects to capture.
- Cell walls. There is nothing in Pixcavator designed for that at this time. If, however, you can capture the inside and the outside contours of cells, there is a way to do this. Subtract the inside area from the outside and then divide by the average of the two perimeters. This will give you a decent estimate of the thickness if the contours aren't too rugged.
- Cell distribution. The centers of cells are provided, so the distances can be computed for all pairs of cells. Then the histogram of the distances can be build with Excel. There may be other ways via statistical programs for Excel.
cellAnalyst
It is well known that the digital microscope has led to an explosion of the number of images that the researcher has to deal with. On the one hand, this opens opportunities of gathering enormous amounts of data. On the other hand, tools for automatic image analysis and data management become a necessity.
cellAnalyst is such a tool. It is intended to help the researcher to analyze his microscopy images and manage the output data.
Just to remind you, cellAnalyst by AssaySoft Inc [1] is an advanced image-mining tool in a user-friendly package. It is designed to automate the analysis of digital images, especially ones coming from cell biology. It works as follows:
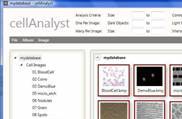
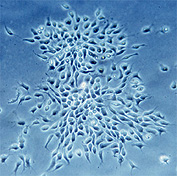
- The images are initially presented in a photo album format.
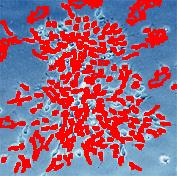
- With just a few clicks, cells have been detected, captured, and measured.
- The cells are listed in a table along with their characteristics.
- Each such table is saved as an entry in a searchable database.
Items 2 and 3 came originally from Pixcavator
It is especially suitable for analysis of cell images, cell counting and classification. In each image, cell cells are detected, captured, and measured. This data is presented as a table that lists all cells along with their characteristics. Each such table is recorded as an entry in a searchable database. Image processing and image management tools are also provided.
More features are planned for the future with the goal of a complete toolbox for high content analysis (HCA) and high content screening [2] (HCS). A web based application is also available. You can download cellAnalyst at AssaySoft.com. The software comes with a complete user’s guide and a tutorial.
It was initially based on Pixcavator SDK but now it has database capabilities as well. All image analysis data is saved and now you can find all images in your collection that have, say, between 50 and 70 cells of sizes between 100 and 200 pixels. Similar queries are possible with respect to shapes and locations of the cells.
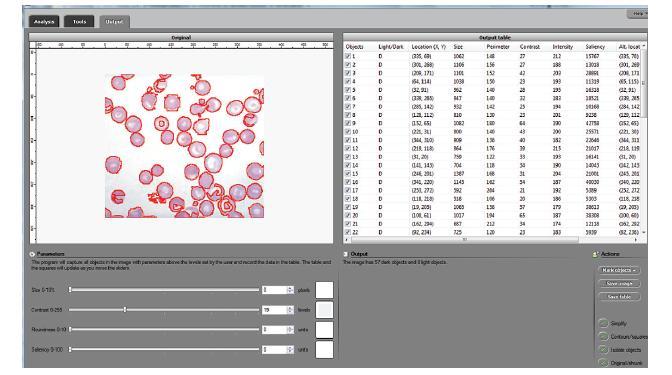
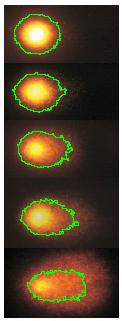
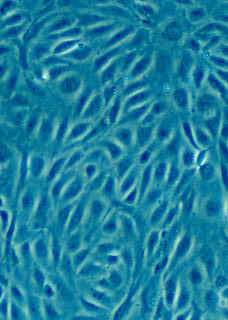
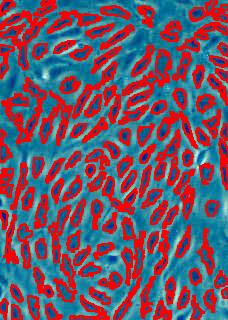
The processing starts with a complete analysis of the image with no deformation, smoothing, blurring, approximation, etc. This allows the user to conduct analysis only once and later display the parts of the output data relevant at that time. The output includes the image with cells’ contours captured and a spreadsheet with locations and measurements of the cells. The displayed measurements and characteristics of the identified cells include area, perimeter, intensity, contrast, and many more.
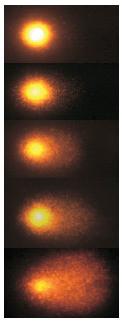
The software takes advantage of the lossless analysis by being highly interactive. First, the user can instantly change what features are to be counted as cells by moving sliders corresponding to cells’ characteristics. The output data is then updated in real time. As a result, the user can quickly visualize a number of different segmentations and choose the best one. In addition, the software can provide analysis results on different scales; for example, clusters of cells — cells — nuclei, etc. Second, the user can manually exclude features from analysis by simply clicking on them. This allows an easy way of dealing with noise, image imperfections, irrelevant details, etc.
The veracity of the analysis data has been verified using real world images. First, the results have been compared to images of cells analyzed manually. Second, ground truth images were analyzed and the output data was confirmed with the pixel accuracy. The results are reliable and repeatable.
A couple of examples of images to compare the results with those of CellProfiler are at our image gallery along with other applications in microscopy.
Observe that cellAnalyst can also be seen as a visual search engine. Indeed, the search is based entirely on the data extracted from images instead of text, tags, etc. The difference is that its search however is based on concrete data collected from the image: cells quantity, sizes, shapes, and locations. As a result it does not share CBIR problems.
New features in cellAnalyst 2.0
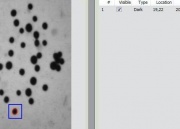
The main new feature in version 2.0 is Partial Analysis. The user can now start with analysis of just a portion of the image. The user draws a rectangle around a cell, and the analysis instantly determines its size and contrast.
Analysis of images may be a time consuming task especially if the analysis setting have to be determined by trial and error. The time to analyze an image is a function of its size. The larger an image, the longer it will take to analyze it. To get faster analysis, one may start with analysis of just a portion of the image. One way to solve this problem is that user draws a rectangle (Region Of Interest) on the image, and the analysis is done only in that region. If the ROI is small enough (50 x 50 pixels), analysis can be done within a second. User can move the sliders and see the effects instantly. The contours of the objects will move and user will be able to capture the desired objects. Once the analysis settings are determined from the ROI, the complete image can be quickly analyzed using the same settings. See also Analysis strategy.
Other improvements are these:
- The Roundness of every object found in the image is computed and displayed in the output table.
- Image enhancement functions are added: you can adjust brightness, contrast, color balance, gamma correction, and saturation.
- The estimated Processing time is computed and displayed so that the user can plan ahead.
- Annotation can be added to images; it can later be used for search.
Examples
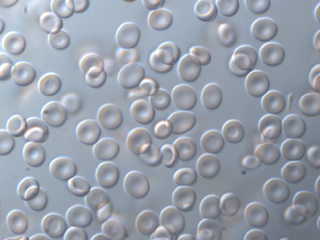
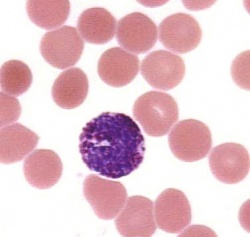
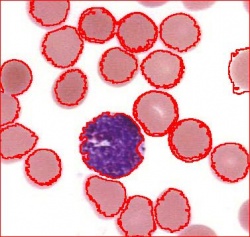
Blood cells
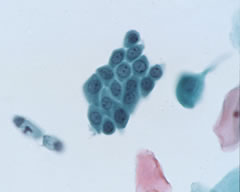
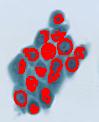
Stemcells
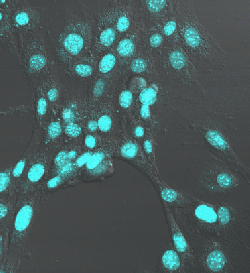
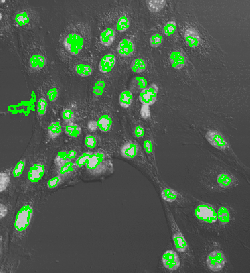
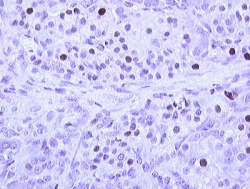
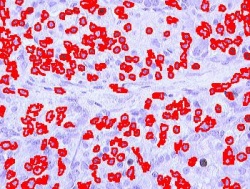
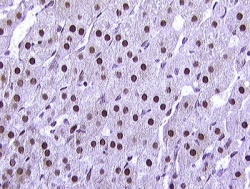
Nuclei
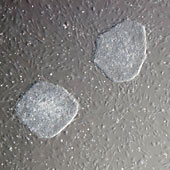
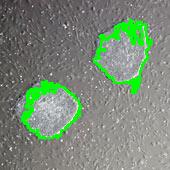
Comet DNA
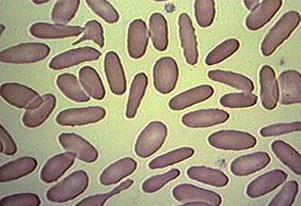
Other cells
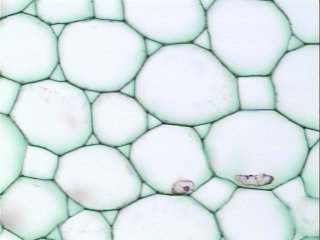
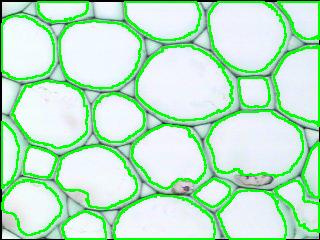
The approach and the software are also applicable to Particle analysis.
For more examples, see AssaySoft's image gallery.
See also Image analysis software.
Top finds
- Casinos Not On Gamstop
- Non Gamstop Casinos
- Casino Not On Gamstop
- Casino Not On Gamstop
- Non Gamstop Casinos UK
- Casino Sites Not On Gamstop
- Siti Non Aams
- Casino Online Non Aams
- Non Gamstop Casinos UK
- UK Casino Not On Gamstop
- Non Gamstop Casino UK
- UK Casinos Not On Gamstop
- UK Casino Not On Gamstop
- Non Gamstop Casino UK
- Non Gamstop Casinos
- Non Gamstop Casino Sites UK
- Best Non Gamstop Casinos
- Casino Sites Not On Gamstop
- Casino En Ligne Fiable
- UK Online Casinos Not On Gamstop
- Online Betting Sites UK
- Meilleur Site Casino En Ligne
- Migliori Casino Non Aams
- Best Non Gamstop Casino
- Crypto Casinos
- Casino En Ligne Belgique Liste
- Meilleur Site Casino En Ligne Belgique
- Bookmaker Non Aams
- カジノ ライブ
- онлайн казино с хорошей отдачей
- スマホ カジノ 稼ぐ
- ブック メーカー オッズ
- Top 3 Nhà Cái Uy Tín Nhất
- Trang Web Cá độ Bóng đá Của Việt Nam
- Casino En Ligne Avis
- Casino En Ligne France
- Casino En Ligne
- 꽁머니 토토
- Casino Online Non Aams
- Migliori Casino Non AAMS
- Meilleur Casino En Ligne
- Casino En Ligne France Légal
- Casino En Ligne France Légal
- Casinos En Ligne
- Mejores Casinos Online
