This page is a part of CVprimer.com, a wiki devoted to computer vision. It focuses on low level computer vision, digital image analysis, and applications. It is designed as an online textbook but the exposition is informal. It geared towards software developers, especially beginners, and CS students. The wiki contains mathematics, algorithms, code examples, source code, compiled software, and some discussion. If you have any questions or suggestions, please contact me directly.
Topology graph
From Computer Vision Primer
Start with Objects in binary images and Objects in gray scale images.
The topology graph captures the hierarchy of objects in images:
- in binary images: black and white objects;
- in gray scale images: light and dark objects.
Also, the hierarchy includes that of objects and their holes.
Pixcavator is constructing the topology graph during the first, automatic stage of image analysis. Download the free Pixcavator Student Edition here.
Contents |
Binary images
This hierarchy is based on inclusion (see Inclusion tree) of objects. This is about inclusion of holes in objects and objects located inside holes.
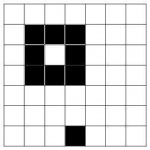
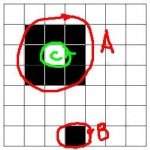
An example is below. As always, dark are labeled with red and light with green.
The construction of the topology graph can - but don't have to - be carried out by means of our algorithm for binary images.
Since the objects - black and white both - never overlap, the topology graph of a binary image is always a tree (it does not have to be connected though).
See also Augmented topology graph below.
Exercise. Draw the topology graph of the "figure eight".
Exercise. Draw the topology graph of the white "figure eight" on the black background.
Topology graphs of the frames of a gray scale image
As the image is thresholded a sequence of binary images (frames) appears. Each of them is partitioned into connected black and white regions. Each frame has its own topology graph.
The collection of all possible cycles/objects is organized in a graph, the topology graph of the gray scale image. The topology graphs of the frames form a sequence. They are arranged in layers within the graph.
Combined, these graphs form topology graph. Its links reflect merging and splitting of cycles as we move from frame to frame:
This hierarchy is based on inclusion (see Inclusion tree) of objects.
Within each frame, this is about larger dark/light objects containing smaller light/dark objects.
Between consecutive frames, this is about larger dark/light objects containing smaller dark/light objects.
Generally, the topology graph of a gray scale image isn't a tree, see example below. The reason is that a dark object may overlap a light one.
An example
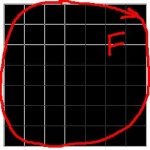
Below we have a gray scale image, its frames, followed by frames with cycles.
Exercise. Suppose there is an extra black pixel located at (a) left upper, (b) right upper, (c) left lower, (d) right lower corner. Modify the above graph to obtain the topology graph of these images.
The structure of the topology graph


The arcs in the graph indicate inclusion. Suppose we change the threshold from 0 to 255. Then, any of the minima of the gray scale function will produce a sequence of growing dark objects, up to some threshold. At the same time, any of the maxima will produces a sequence of shrinking light objects, starting at some threshold. There are also three other kinds of topological events, see the binary algorithm (corresponding to similar events while one is adding pixels):
- a dark object appears,
- dark objects merge,
- a dark object forms a hole inside (a light object appears),
- a light object splits,
- a light object disappears.
Of course, these can happen simultaneously.
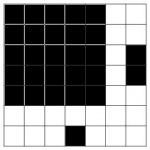
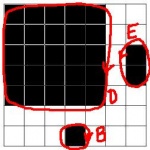
One can form the topology graph from the two “inclusion trees” – the one for the dark objects and the other for the light. The latter is turned upside down and attached to the former wherever a topological event #3 happens. The topology graph may be a tree (above), but generally it isn't. Consider, for example, the negative of the image above, below. (The two inclusion trees are the all red and the all green.)


As the threshold grows, new pixels are being added and the cycles in the image appear and disappear. Components merge, holes split, etc. and the topology keeps changing. The information about these changes is recorded in the topology graph. Each node in the graph represents a cycle, and the arcs represent merging and splitting of the cycles.
Exercise. If you "wipe the smile off the face", what will happen to its topology graph?
See also Graph representation of images.
The augmented topology graph
This partition can (but don't have to) be carried out by means of our algorithm for binary images. It is based on cell decomposition of images. This information is recorded in a graph for each frame, see Adding Pixels.
As a matter of convenience instead of the topology graph we build the augmented topology graph, or simply the augmented graph, of the image. The growing threshold creates a partial order on the set of pixels. In that order the pixels are added to the image. The procedure of building this graph with nodes representing cycles is exactly the same as the one presented in Adding Pixels. During this process the 256 frames will appear but between them there will be auxiliary stages. The frames will generate the principal cycles and the rest are the auxiliary cycles. The graph breaks into layers: auxiliary nodes, principal nodes of the 0th frame, auxiliary nodes, principal nodes of the 1st frame, etc. The topology graph can be extracted from the augmented graph by removing all auxiliary nodes and adding arcs between principal nodes accordingly. Unlike the topology graph, the augmented graph is dependent on the order the pixels (within frames) are added, as well as edges and vertices.
Suppose the image consists of two pixels, black and gray, on white background. Then the construction of the augmented graph starts with adding the black pixel. The graph at this stage is given below. It ends with a single principal cycle, H. The rest are auxiliary.
Next, if the gray pixel isn’t adjacent to the black, the second stage looks exactly the same as the first. It contains a single frame cycle, H’. In this case the augmented graph consists of these two disconnected parts and the topology graph is simply: H, H’.
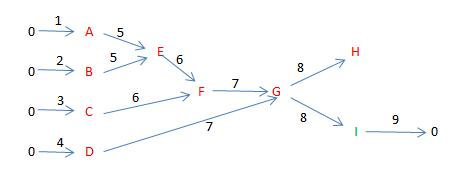
If the gray pixel is adjacent to the black, the augmented graph is connected. There are 6 steps. Initially only H, the 0-cycle created during the first stage, is present. Then, two new vertices are added creating two new 0-cycles, B’ and C’. Then two edges are added and these three cycles merge. When the third edge is added, a 1-cycle appears. Adding the square removes this cycle. Only one 0-cycle is left, H’ (a two pixel dark object). The topology graph is simply H → H’.
Now, H’ contains H. Therefore only one of them should be counted. Which one? This is for the user to decide. He may be interested in larger objects (H’) or objects with higher contrast from the surroundings (H).
The topology graph should be understood independently from the augmented graph. It can be constructed based entirely on the image and its frames, as in the above example.
Exercise. What if a third pixel is to be added? Consider all the cases.
Notes
Some of the principal cycles will have to be discarded by the user. The remaining ones will represent the simplified topology of the image and, accordingly we have the simplified topology graph. We will call these cycles active cycles. Ideally, the active cycles of the same dimension shouldn't contain each other, see Objects in gray scale images.


Exercise. Draw the topology graph for these images.
Top finds
- Casinos Not On Gamstop
- Non Gamstop Casinos
- Casino Not On Gamstop
- Casino Not On Gamstop
- Non Gamstop Casinos UK
- Casino Sites Not On Gamstop
- Siti Non Aams
- Casino Online Non Aams
- Non Gamstop Casinos UK
- UK Casino Not On Gamstop
- Non Gamstop Casino UK
- UK Casinos Not On Gamstop
- UK Casino Not On Gamstop
- Non Gamstop Casino UK
- Non Gamstop Casinos
- Non Gamstop Casino Sites UK
- Best Non Gamstop Casinos
- Casino Sites Not On Gamstop
- Casino En Ligne Fiable
- UK Online Casinos Not On Gamstop
- Online Betting Sites UK
- Meilleur Site Casino En Ligne
- Migliori Casino Non Aams
- Best Non Gamstop Casino
- Crypto Casinos
- Casino En Ligne Belgique Liste
- Meilleur Site Casino En Ligne Belgique
- Bookmaker Non Aams
- カジノ ライブ
- онлайн казино с хорошей отдачей
- スマホ カジノ 稼ぐ
- ブック メーカー オッズ
- Top 3 Nhà Cái Uy Tín Nhất
- Trang Web Cá độ Bóng đá Của Việt Nam
- Casino En Ligne Avis
- Casino En Ligne France
- Casino En Ligne
- 꽁머니 토토
- Casino Online Non Aams
- Migliori Casino Non AAMS
- Meilleur Casino En Ligne
- Casino En Ligne France Légal
- Casino En Ligne France Légal
- Casinos En Ligne
- Mejores Casinos Online
