This page is a part of CVprimer.com, a wiki devoted to computer vision. It focuses on low level computer vision, digital image analysis, and applications. It is designed as an online textbook but the exposition is informal. It geared towards software developers, especially beginners, and CS students. The wiki contains mathematics, algorithms, code examples, source code, compiled software, and some discussion. If you have any questions or suggestions, please contact me directly.
Fields related to computer vision
From Computer Vision Primer
The article was originally based on a part of Quantitative Biological Image Analysis by Erik Meijering and Gert van Cappellen (Chapter 2 of Imaging Cellular and Molecular Biological Functions, S. L. Shorte and F. Frischknecht (eds.), Springer-Verlag, Berlin, 2007, pp 45-70).
Contents |
Image Formation: object in -> image out
It may be important to know how the image was formed originally. The reason is that if you have a priori knowledge of the hardware that produced the image you may be able to use it to mitigate noise and imperfections (image processing below). However, it seems to me that the hardware manufacturers should be taking care of this.
Image Processing: image in -> image out
Smoothing, sharpening, blurring and de-blurring, other image enhancement, and on and on, hundreds of tasks with many different algorithms for each.
Examples:
Since the output is an image, the main purpose is to supply people with better looking images. A secondary purpose is preprocessing for image analysis to improve quality. The term “quality” is relative and depends on the context. One thing clear is that image processing leads to loss of information. That could harm your image analysis. So, you need insight into the problem to make sure that what you lose isn’t important. That insight comes from image analysis – full circle...
Image Analysis: image in -> features out
Let’s start with “dual purpose” image processing tasks. These operations are also image analysis tools:
- Intensity transformation – the value of each pixel is replaced with another value that depends only on the initial value. The main application is binarization (via Thresholding or otherwise) as many image analysis tasks are applicable only to binary images.
- Local filtering - the value of each pixel is replaced with another value that depends only on the values of pixels in a certain neighborhood of this pixel. One of the main applications is edge detection (pixels where the values are changing the fastest). Morphology is another method of detecting edges (dilated version minus eroded version - see Image processing) but is limited to binary images. Unfortunately, neither method guarantees an unbroken sequence of edges. As a result, it may be impossible to reconstruct the object this sequence is supposed to surround.
Here are a few more image processing methods that are used for analysis:
- Morphology – erosions, dilations, etc. Repeated erosions will remove small particles then you can count the rest (“granulometry”). Repeated erosions that also preserve the topology will produce “skeletonization” of objects. In full generality this issue will be addressed under Robustness of topology (specifically, robustness under morphological operations).
- Colocalization – evaluating the degree of overlap of two biological entities differently colored.
- Fourier transform – finding periodic patterns in the image. It tells you a lot about the textures present in the image.
- Image segmentation – finding objects in the image. There are many interesting methods (watershed, active contours, topology).
These are image processing tools used for image analysis but most of image processing/enhancement tools however are just that. Sometimes it works both ways:
- Boundaries of objects can be enhanced by means of edge detection.
- Fourier transform in combination with its inverse is used for denoising.
Several images may be the input - in case of video or stereo vision.
Computer Vision: image in -> interpretation out
Elsewhere in the article: "...image analysis... is defined as the act of measuring (biologically) meaningful object features in an image." From this point of view,
image analysis = low level computer vision.
(BTW, low level computer vision is the subject of this wiki.) Because of this overlap the term “computer vision” is preferable.
“Analysis” is simply too broad. Indeed, does finding the average color in the image qualify as analysis? Yes, of course. Does it tell as anything about the contents of the image? No, not a bit.
Another definition:
high level interpretation = image understanding.
Computer Graphics: numbers in -> image out
Instead of numbers one could have math functions that produce numerical descriptions of images. These descriptions are likely to be different from those in computer vision: vector vs. raster images (the difference is insignificant in light of Cell decomposition of images).
Computer Graphics has been also called “the inverse of image analysis”. That would seem to imply that if you use Image Analysis followed by Computer Graphics you’ll end up with the original image. That would make sense only if the data produced by image analysis does not go very deep (not image segmentation or Fourier transform etc). I think that Computer Graphics is mostly irrelevant for Computer Vision.
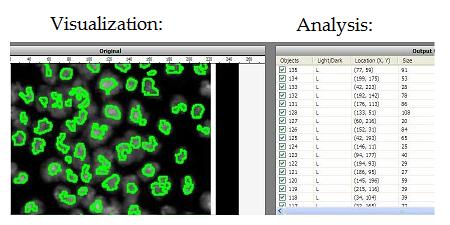
Visualization: image in -> representation out
The idea is that high dimensional image data is transformed into a more primitive representation. Displaying contours of objects is an example of that, illustrated below with Pixcavator. "Pseudocoloring" is an interesting subtopic here even though it can be also classified as image processing.
Discussion
Example: even though computing the distribution of colors in the image is analysis, it does not tell anything about the contents of the image. Then:
- Low level image analysis = image processing.
- High level image analysis = low level computer vision.
- High level computer vision = image understanding.
The difference between low level analysis and high level analysis is that the latter reveal the content of the image – possibly on a low level. But how? My answer is:
There is a simple test for that:
The analysis is local when cutting the image into pieces
and reassembling them in an arbitrary way does not affect the results.
You can even imagine that you arrange the pixels in a single row. You can analyze those pixels all you want but they can’t reveal the content of the picture! (BTW, this is related to some methods of Pattern recognition.) Here are some examples.
Local analysis:
- anything based on color/intensity histogram,
- statistics (mean, standard deviation, etc);
- anything based on local filtering, in particular Edge detection.
Global analysis:
- Image segmentation;
- Fourier transform;
- Texture and pattern;
- Morphological analysis (but only if the output is still image segmentation).
In ImageJ’s Features page [1], we find no mention of image segmentation:
Analysis:
- Measure area, mean, standard deviation, min and max of selection or entire image.
- Measure lengths and angles.
- Use real world measurement units such as millimeters.
- Calibrate using density standards.
- Generate histograms and profile plots.
The only global item on that list is #2. And one still needs to find something to measure – it would have to come from image segmentation.
In visual image search (CBIR) image analysis is typically local: color distribution, edge distribution, other “descriptors”. Studying patches instead of pixels is still local if you measure the patches in pixels (filtering, morphology). But suppose you cut the image into 100 patches and then collect global information from each patch. Rearranging these patches will unlikely to produce a real life image. Lincoln from MS Research and some others operate this way.
To summarize,
High level analysis = global analysis = low level computer vision.
Top finds
- Casinos Not On Gamstop
- Non Gamstop Casinos
- Casino Not On Gamstop
- Casino Not On Gamstop
- Non Gamstop Casinos UK
- Casino Sites Not On Gamstop
- Siti Non Aams
- Casino Online Non Aams
- Non Gamstop Casinos UK
- UK Casino Not On Gamstop
- Non Gamstop Casino UK
- UK Casinos Not On Gamstop
- UK Casino Not On Gamstop
- Non Gamstop Casino UK
- Non Gamstop Casinos
- Non Gamstop Casino Sites UK
- Best Non Gamstop Casinos
- Casino Sites Not On Gamstop
- Casino En Ligne Fiable
- UK Online Casinos Not On Gamstop
- Online Betting Sites UK
- Meilleur Site Casino En Ligne
- Migliori Casino Non Aams
- Best Non Gamstop Casino
- Crypto Casinos
- Casino En Ligne Belgique Liste
- Meilleur Site Casino En Ligne Belgique
- Bookmaker Non Aams
- カジノ ライブ
- онлайн казино с хорошей отдачей
- スマホ カジノ 稼ぐ
- ブック メーカー オッズ
- Top 3 Nhà Cái Uy Tín Nhất
- Trang Web Cá độ Bóng đá Của Việt Nam
- Casino En Ligne Avis
- Casino En Ligne France
- Casino En Ligne
- 꽁머니 토토
- Casino Online Non Aams
- Migliori Casino Non AAMS
- Meilleur Casino En Ligne
- Casino En Ligne France Légal
- Casino En Ligne France Légal
- Casinos En Ligne
- Mejores Casinos Online
