Computer Vision Primer: online book of mathematics related to image analysis and data analysis: calculus, topology, linear algebra etc, image analysis software, and applications in sciences and engineering.
Topological data analysis
From Computer Vision Primer
Suppose we have conducted 1000 experiments with a set of 100 various measurements in each. Then each experiment is a string of 100 numbers or simply a vector of dimension 100. The result is a collection of disconnected 1000 points, called a point cloud, in the 100-dimensional Euclidean space.
It is impossible to visualize this data as any representation that one can see is limited to dimension 3 (by using colors one gets 6, time - 7). Yet we still need to answer questions about the object behind the point cloud:
- Is it one piece or more?
- Is there a tunnel?
- Or a void?
- And what about possible 100-dimensional topological features?
Through clustering (and related approaches) statistics answers the first question. The rest need a topological approach to the problem.
For a point cloud in a euclidean space, suppose we are given a threshold r so that any two points within r from each other are to be considered "close". Then each pair of such points is connected by an edge. If three points are “close”, we add a face, etc. The result is a simplicial complex that approximates the, possible, manifold M behind the point cloud.
We want to count the number of topological features in M by means of the Betti numbers: the number of connected components in M, the number tunnels, the number of voids, etc. This information is contained in the homology group of the complex.
Further, to deal with noise and other uncertainty one needs to evaluate the significance of these topological features. For each value of the threshold r we build a separate simplicial complex, then combine the homology groups of these complexes in a single structure, and count the features with a high measure of robustness. This measure, called persistence, is the length of the interval of values of r for which the topological features is present.
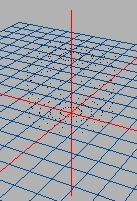
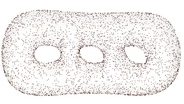
Even more important than these "global" properties may be the local topology of the data. For example, in both of the images above the datasets are 3-dimensional but what's behind is 2-dimensional (surface). This is called manifold learning and is related to dimensionality reduction. See this recent project: The topology of data.
Some issues with the traditional approaches to manifold learning are:
- They rely on local linearity of the dataset and may fail when the manifold is highly curved. But it is in exactly this situation when finding this manifold is especially important. Indeed, knowing the manifold allows us to measure distances along geodesics of this manifold.
- They assume that the dataset is a manifold in the first place. There are numerous examples of datasets where this assumption is violated, such as graphs.
- They assume that the topological space behind the data set inherits the topology of the Euclidean space that contains it (see Relative topology).
- Even when non-Euclidean metrics (such as the Manhattan metric) are used, the topology is still Euclidean. The possibility of non-Euclidean topology is ignored.
See also Pattern recognition in computer vision.
Compare to Geometry of data.
Broader issues are discussed nuder Computational topology.
Top finds
- Casinos Not On Gamstop
- Non Gamstop Casinos
- Casino Not On Gamstop
- Casino Not On Gamstop
- Non Gamstop Casinos UK
- Casino Sites Not On Gamstop
- Siti Non Aams
- Casino Online Non Aams
- Non Gamstop Casinos UK
- UK Casino Not On Gamstop
- Non Gamstop Casino UK
- UK Casinos Not On Gamstop
- UK Casino Not On Gamstop
- Non Gamstop Casino UK
- Non Gamstop Casinos
- Non Gamstop Casino Sites UK
- Best Non Gamstop Casinos
- Casino Sites Not On Gamstop
- Casino En Ligne Fiable
- UK Online Casinos Not On Gamstop
- Online Betting Sites UK
- Meilleur Site Casino En Ligne
- Migliori Casino Non Aams
- Best Non Gamstop Casino
- Crypto Casinos
- Casino En Ligne Belgique Liste
- Meilleur Site Casino En Ligne Belgique
- Bookmaker Non Aams
- カジノ ライブ
- онлайн казино с хорошей отдачей
- スマホ カジノ 稼ぐ
- ブック メーカー オッズ
- Top 3 Nhà Cái Uy Tín Nhất
- Trang Web Cá độ Bóng đá Của Việt Nam
- Casino En Ligne Avis
- Casino En Ligne France
- Casino En Ligne
- 꽁머니 토토
- Casino Online Non Aams
- Migliori Casino Non AAMS
- Meilleur Casino En Ligne
- Casino En Ligne France Légal
- Casino En Ligne France Légal
- Casinos En Ligne
- Mejores Casinos Online
